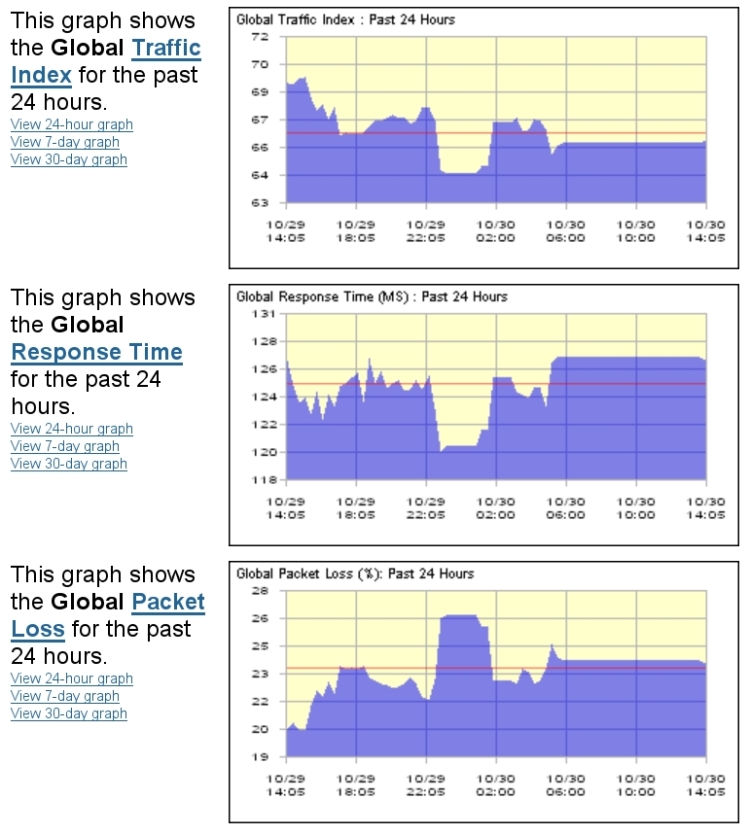
Courtesy of internettrafficreport.com, the effects of the hurricane Sandy can visibly be seen on global internet statistics, but interesting things happen after!
The interesting things here are that you can visibly see the impact on the ‘net. It starts with the rapidly decreasing netflow starting at about 10PM on the graph (it’s a shame it doesn’t show what timezone it applies to!), with packet loss growing at an equally alarming rate. It then plateus out until things are re-routed, and connectivity for everyone else unaffected is eventually restored by about 1:30AM. The Internet was largely ‘healed’ in about 3.5 hours, not bad for a sev1 response!.
The final interesting thing is the subsequent relative stability of the Internet after reconfiguration. The performance is generally slightly degraded given the loss of New York’s traffic and data in transit, but is afterwards looks strangely too uniform and consistent, it’s like the event in itself has caused the Internet to stablise. Let’s see how long it lasts….
My thoughts go to those lost and those who have lost in the disaster.
Update:-
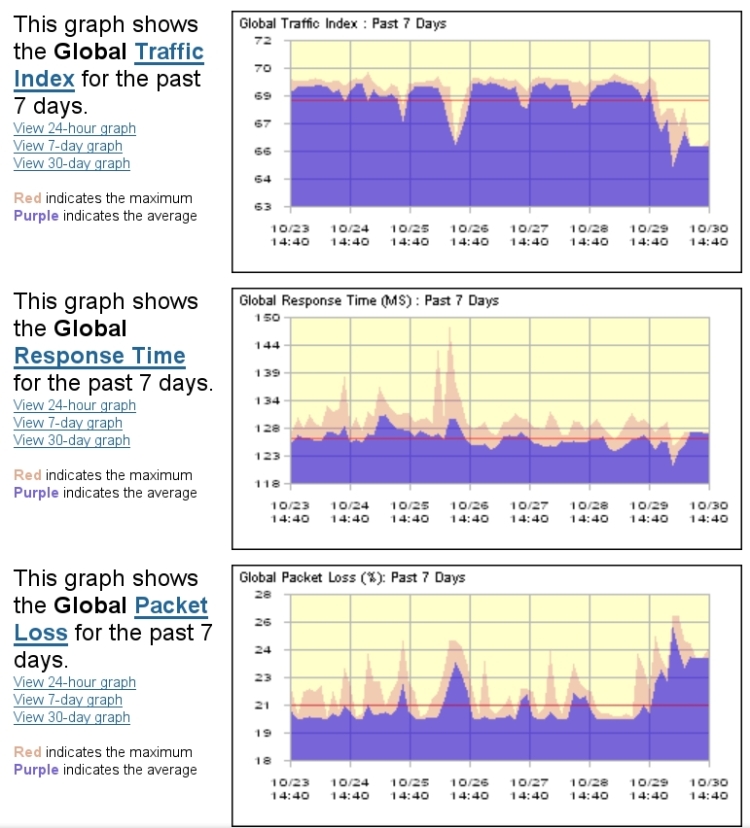
7-day stats show drop start from about 2PM as infrastructure starts to fail from the bad weather that preceeded the flooding. This shows that there was a loss from the affected sites which, by internettrafficreport.com’s measure accounted for approximately 3% of the global internet traffic.

